
Financial Analysis
| Finacial Year | Net Profit (after tax) | Gross NPA (Amount) | Gross NPA (%) | Net NPA (Amount) | Net NPA (%) | ROA % | ROE % | NIM |
|---|---|---|---|---|---|---|---|---|
| 30.09.25 | 45.43 | 168.02 | 0.035 | 2.84 | 0.0006 | 0.0092 | 0.1724 | 0.0407 |
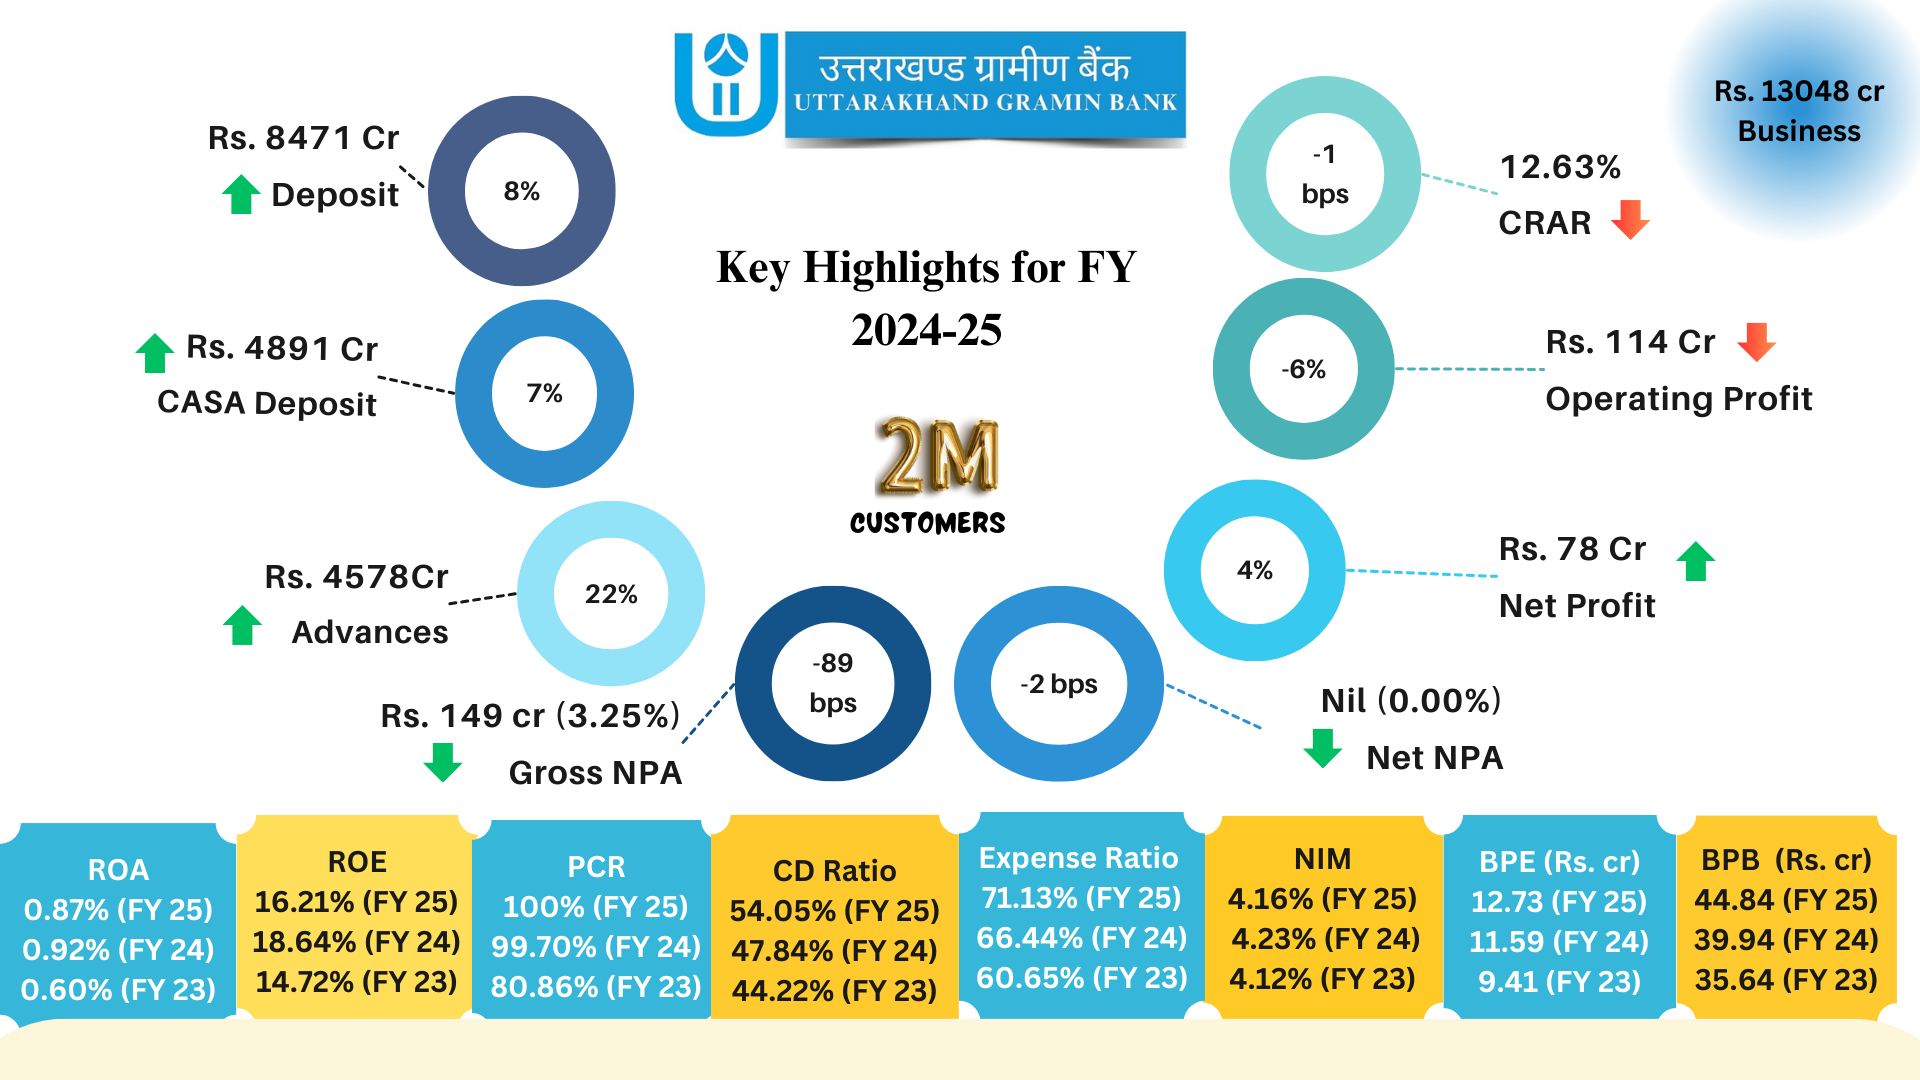
| 31.03.25 | 78.11 | 148.86 | 0.0325 | 0 | 0 | 0.0087 | 0.1621 | 0.0416 |
| 31.03.24 | 75.26 | 155.2 | 0.0414 | 0.69 | 0.0002 | 0.0092 | 0.1864 | 4.23 |
| 31.03.23 | 43.78 | 171.89 | 0.0546 | 45.07 | 0.015 | 0.006 | 0.1472 | 4.12 |
| 31.03.22 | 6.82 | 201.16 | 0.0721 | 80.69 | 0.0304 | 0.001 | 0.0269 | 3.85 |
| 31.03.21 | 1.57 | 203.87 | 0.0785 | 93.49 | 0.0379 | 0.0003 | 0.0115 | 3.61 |
| 31.03.20 | -79.24 | 180.52 | 0.0744 | 81.67 | 0.0353 | -0.0139 | -0.5982 | 3.32 |
| FY | Deposits | CASA Deposits | CASA % | Advances | Total Business | CD Ratio | No. of branches | No. of staff |
|---|---|---|---|---|---|---|---|---|
| 30.09.25 | 8777.71 | 4987.23 | 0.5682 | 4796.04 | 13573.7 | 0.5464 | 294 | 1132 |
| 31.03.25 | 8470.5 | 4891.3 | 0.5775 | 4577.95 | 13048.45 | 0.5405 | 291 | 1025 |
| 31.03.24 | 7833.62 | 4567.81 | 0.5826 | 3747.64 | 11581.26 | 0.4784 | 290 | 999 |
| 31.03.23 | 7117.76 | 4140.29 | 0.5817 | 3147.4 | 10265.16 | 0.4422 | 288 | 1091 |
| 31.03.22 | 6485.54 | 3764.38 | 0.5804 | 2790.81 | 9276.35 | 0.4303 | 286 | 1054 |
| 31.03.21 | 6005.01 | 3418.2 | 0.5692 | 2596.29 | 8601.3 | 0.4324 | 286 | 1062 |
| 31.03.20 | 5469.76 | 3075.93 | 0.5624 | 2427.7 | 7897.46 | 0.4438 | 286 | 1110 |
| FY | Govt. Securities | Other securities | Mutual Fund | TDRs |
|---|---|---|---|---|
| 30.09.25 | 3618.24 | 25.21 | 37.74 | 55.14 |
| 31.03.25 | 3620.5 | 25.21 | 52.74 | 44.37 |
| 31.03.24 | 3382.32 | 25.4 | 52.51 | 23.99 |
| 31.03.23 | 3382.32 | 25.6 | 37.29 | 11.7 |
| 31.03.22 | 3223.36 | 25.79 | 18.04 | 11.13 |
| 31.03.21 | 2840.55 | 25.99 | 17.85 | 15.02 |
| 31.03.20 | 2432.43 | 26.18 | 42.68 | 16.68 |
- वार्षिक पुस्तक 2024-25
Page 1 to 30
Page 31 to 60
Page 61 to 90
Page 91 to 136
हमारे बारे में @यूजीबी
May i help you?
